Guides / Financial Planning
Average Net Worth by Age: Where Do You Stand?
Net worth is the single best snapshot of your financial health — but comparing yourself to national averages can be misleading if you do not know which number to trust. This guide breaks down median and average net worth by age using the Federal Reserve's newly released 2025 Survey of Consumer Finances, explains what counts in the calculation, and shows you how to close the gaps.
Last updated: October 2026 (Federal Reserve 2025 SCF, released October 9, 2026)
TL;DR - Quick Answer
- Under 35: Median net worth $33,000 | Average $135,400
- Ages 35-44: Median net worth $155,600 | Average $681,900
- Ages 45-54: Median net worth $253,700 | Average $1,244,500
- Use median, not average: In every age group the average is 4 to 5 times the median because a small number of very wealthy families pull it up
- What changed in 2025: Median net worth for families under 35 fell 23% after inflation, while families 75 and older rose 37% to $504,900
Calculate your number with our Net Worth Calculator, Retirement Calculator, and Compound Interest Calculator.
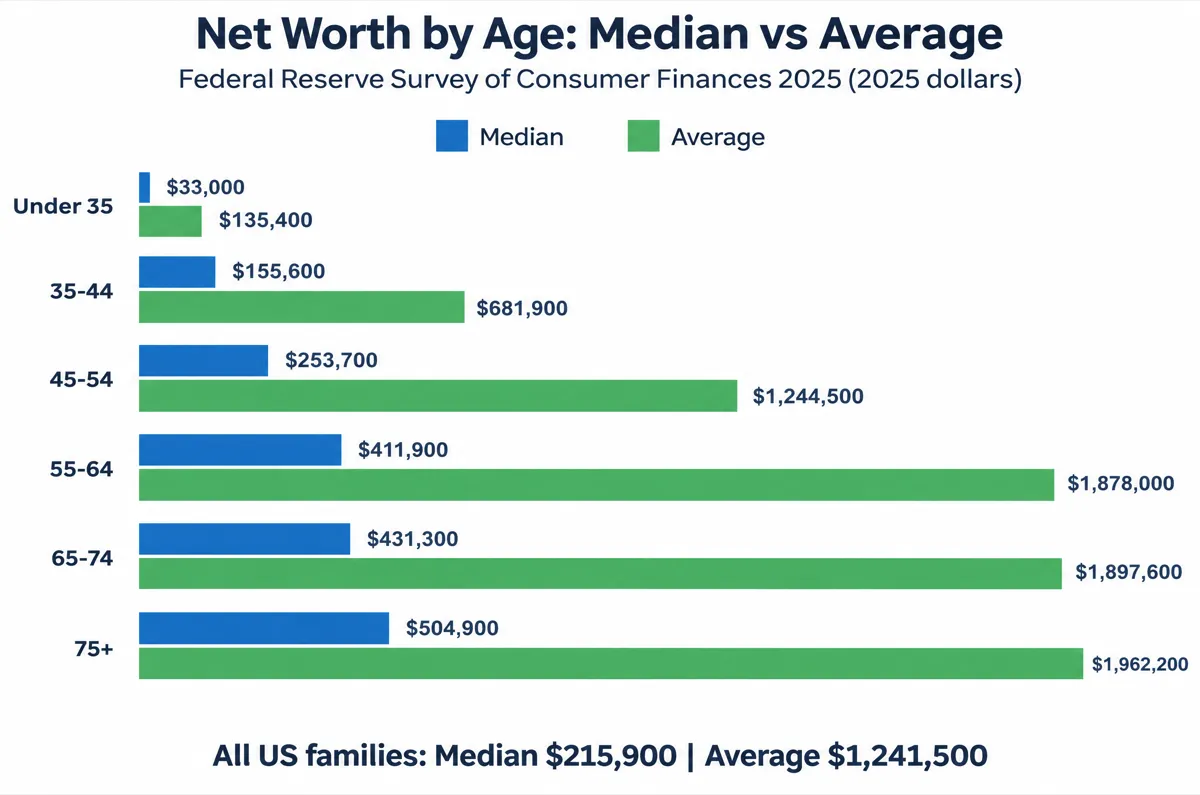
Net Worth by Age Group: Federal Reserve 2025 Data
The Federal Reserve's Survey of Consumer Finances (SCF) is the most comprehensive source of household wealth data in the United States. Conducted every three years, it surveys thousands of American families on assets, liabilities, and income. The 2025 survey was released on October 9, 2026 and replaces the 2022 survey as the current benchmark. All dollar figures below are in 2025 dollars, grouped by the age of the family's reference person.
| Age Group | Median Net Worth | Average Net Worth | Median Change vs 2022 |
|---|---|---|---|
| Under 35 | $33,000 | $135,400 | -23% |
| 35-44 | $155,600 | $681,900 | +5% |
| 45-54 | $253,700 | $1,244,500 | -6% |
| 55-64 | $411,900 | $1,878,000 | +3% |
| 65-74 | $431,300 | $1,897,600 | -4% |
| 75 or older | $504,900 | $1,962,200 | +37% |
Source Federal Reserve, Changes in U.S. Family Finances from 2022 to 2025 (Table 2, October 2026). Checked October 2026. Median represents the middle family — half above, half below. Average (mean) is pulled upward by high-net-worth outliers. Changes are inflation-adjusted. All US families: median $215,900 (+2%), average $1,241,500 (+7%).
What These Numbers Tell You
Net worth rises with age through the mid-career years because of retirement contributions, mortgage paydown, and peak earning years. The median jumps from $33,000 for families under 35 to $155,600 for ages 35-44, a 4.7x increase that reflects home purchases and a decade of 401(k) contributions. By ages 55-64 the median reaches $411,900, yet the average is $1,878,000 — a gap of $1,466,100 created by wealth concentration at the top.
Two results from the 2025 survey differ from earlier editions. First, families under 35 lost ground: median net worth fell 23% from $42,700 (2022, in 2025 dollars) to $33,000, which the Federal Reserve attributes primarily to the unwinding of business equity gains recorded between 2019 and 2022. Second, families aged 75 and older now have the highest median net worth at $504,900 (up 37%), overtaking the 65-74 group ($431,300, down 4%) for the first time in several surveys. The Fed says the increase was driven mainly by higher retirement account values.
Net Worth Percentiles for All US Families (2025)
If you want to compare against all families instead of one age group, these are the net worth cutoffs from the 2025 survey. A net worth of $300,000, for example, sits above the median but well below the 75th percentile cutoff of $812,800.
| Percentile | Net Worth at Cutoff |
|---|---|
| 25th percentile | $27,900 |
| 50th percentile (median) | $215,900 |
| 75th percentile | $812,800 |
| 90th percentile | $2,539,200 |
Source Federal Reserve 2025 SCF report, Table A.2. Checked October 2026. Figures as of the October 9, 2026 release.
Why Median vs Average Matters
If you are 40 years old and read that the "average" net worth for your age group is $681,900, you might feel behind — even if you are doing fine. That is because the average is a poor measure of what typical Americans have. A single extremely wealthy family in the sample can add millions to the average without changing the median at all.
The 2025 survey shows how large the effect is. The 90th percentile of net worth starts at $2,539,200, and the average net worth of families in the top decile is $8,975,200 — more than 7 times the $1,241,500 average for all families. In the 35-44 age group, a small number of high-earning professionals, business owners, and inherited-wealth families pull the average to $681,900 while the typical family sits at $155,600, a 4.4x gap. The gap is widest at ages 45-54, where the average ($1,244,500) is 4.9x the median ($253,700).
Compare to Median, Not Average
If your net worth is above the median for your age group, you are ahead of at least half of American families. Being below the average but above the median is completely normal — and does not mean you are failing financially.
When Average Is Useful
Average net worth is relevant if you are studying total national wealth, analyzing tax policy, or comparing aggregate savings across decades. For personal benchmarking, always use the median. A second option is to compare your retirement savings to salary-multiple milestones such as Fidelity's 1x by 30, 3x by 40, and 6x by 50 (covered below), which adjust for your income instead of the national average.
What Counts in Net Worth
Net worth is a simple formula: Assets minus Liabilities. What you own minus what you owe. Income is not included — only accumulated wealth and outstanding debt.
Assets (What You Own)
- Home equity: Market value minus remaining mortgage balance
- Retirement accounts: 401(k), 403(b), traditional IRA, Roth IRA, pension balances
- Taxable investments: Brokerage accounts, index funds, individual stocks and bonds
- Cash and savings: Checking, savings, money market, CDs, HYSA balances
- Other assets: Vehicle value, business equity, rental property equity, collectibles (at realistic resale value)
Liabilities (What You Owe)
- Mortgage: Remaining principal on primary and secondary homes
- Student loans: Federal and private education debt
- Auto loans: Outstanding car loan balances
- Credit card debt: Revolving balances (pay these off first)
- Other debt: Personal loans, medical debt, home equity lines of credit (HELOC)
Common Mistakes When Calculating Net Worth
Do not count your gross annual salary — income flows through net worth only when you save or invest it. Do not use the original purchase price of your home; use current market value, and list the full mortgage balance as a liability instead of netting it against the home value twice. Include all retirement accounts even if you cannot access them until 59½ — they are real assets. On the liability side, include every outstanding balance, not just monthly payments.
Example: $595,000 assets - $303,000 liabilities = $292,000 net worth
Case Study: Marcus and Jen, Both 38, in Minneapolis
Household Profile
- Ages: Both 38 (35-44 age group)
- Combined income: $155,000/year
- Marcus: Marketing manager, $82,000
- Jen: Registered nurse, $73,000
- Location: Minneapolis, MN
- Married, one child (age 4)
Benchmark Comparison
- Median net worth (35-44): $155,600
- Average net worth (35-44): $681,900
- Their net worth: $292,000
- vs median: +$136,400 (88% above median)
- vs average: -$389,900 (57% below average)
- Fidelity retirement milestone (3x income by 40): $465,000
Asset Breakdown
- Home value: $410,000 (mortgage is listed under liabilities)
- Marcus 401(k): $68,000 | Jen 401(k): $47,000 | Total: $115,000
- Roth IRAs (combined): $18,000
- Taxable brokerage: $14,000
- Emergency fund (HYSA): $10,000
- Vehicles (2 cars, paid off): $28,000
- Total assets: $595,000
Liability Breakdown
- Mortgage: $300,000 (home equity: $110,000)
- Student loans (Jen): $3,000
- Total liabilities: $303,000
- Net worth: $595,000 - $303,000 = $292,000
Gap Analysis
Marcus and Jen are in a solid position compared to the median — their $292,000 net worth is 88% above the $155,600 median for ages 35-44. They fall well short of the $681,900 average, which is expected because the average is skewed by high-wealth families. Across all US families, $292,000 sits between the median ($215,900) and the 75th percentile ($812,800).
Their biggest vulnerability is retirement savings: $133,000 in 401(k)s and Roth IRAs is 0.86x their $155,000 income. Fidelity's milestone is 3x income by age 40, or $465,000, so a gap of $332,000 remains. That gap cannot be closed in two years, which makes the savings rate the priority. The mortgage is also large at $300,000 (1.9x income), and taxable investments of $14,000 provide little flexibility for mid-term goals.
Recommended Actions
- 1. Raise 401(k) contributions toward the limit — the 2026 limit is $24,500 each ($49,000 combined) and they currently contribute about $22,000 total. Each additional $1,000/month adds $12,000/year in tax-advantaged savings.
- 2. Pay off Jen's remaining $3,000 student loan — small balance, but eliminating it frees cash flow and removes a liability line item.
- 3. Build taxable brokerage to $50,000 — at $800/month into a low-cost index fund, and assuming 7% annual growth, the account passes $50,000 in about 37 months.
- 4. Avoid upsizing the house — a $300,000 mortgage is already 1.9x their income, and a bigger loan would slow retirement contributions.
- 5. Track quarterly — use the Net Worth Calculator to monitor progress; the goal is to close the $332,000 retirement gap toward Fidelity's $465,000 milestone.
How to Increase Net Worth at Any Age
Net worth grows through a combination of saving, investing, debt reduction, and asset appreciation. The strategies below work at every life stage — the priorities just shift depending on where you are in the wealth-building timeline.
Eliminate high-interest debt first
Credit card debt at 20-25% APR destroys net worth faster than any investment can build it. Paying off a $8,000 balance at 22% APR saves $1,760/year in interest — a guaranteed return no index fund can match. After credit cards, tackle auto loans above 7% and private student loans above 6%.
Max retirement accounts every year
In 2026, the IRS limits are $24,500 for a 401(k), $7,500 for an IRA, and $4,400 (self-only) or $8,750 (family) for an HSA if you are eligible. A couple maxing both 401(k)s saves $49,000/year in tax-advantaged accounts alone. Over 20 years at a 7% annual return with year-end contributions, that grows to roughly $2.0 million — use our Compound Interest Calculator to model your timeline.
Sources IRS IR-2025-111, 2026 retirement plan limits (Nov. 13, 2025), IRS Rev. Proc. 2025-19 (2026 HSA limits). Checked October 2026.
Build home equity strategically
Homeownership builds net worth through mortgage principal paydown and long-term appreciation. In the 2025 SCF, median net worth was $458,900 for homeowners versus $10,600 for renters (all ages), a 43x difference. But do not over-concentrate — if home equity makes up most of your net worth, prioritize retirement and investment accounts to diversify.
Avoid lifestyle inflation
Every raise, bonus, and promotion is an opportunity to increase savings rate — not spending. Investing an extra $10,000 every year for a decade grows to about $138,000 at a 7% annual return. On a $75,000 salary, saving 25% ($18,750/year) instead of 15% ($11,250/year) adds $7,500/year, which grows to about $1.04 million over 35 years at 7% (nominal, before inflation).
Retirement Savings Milestones by Age (Salary-Based Rule of Thumb)
Fidelity publishes age-based savings milestones as multiples of your current salary. They apply to retirement savings (401(k), IRA, and similar accounts), not to total net worth, so home equity does not count toward them. Because they scale with income, they can be more useful than national medians. Fidelity assumes a 15% savings rate including employer contributions, retirement at 67, and a retirement income target of 45% of pre-retirement income.
| Age | Retirement Savings Target | Example ($75K Income) |
|---|---|---|
| 30 | 1x annual salary | $75,000 |
| 40 | 3x annual salary | $225,000 |
| 50 | 6x annual salary | $450,000 |
| 60 | 8x annual salary | $600,000 |
| 67 (retirement) | 10x annual salary | $750,000 |
Source Fidelity retirement guidelines. Checked October 2026. These are guidelines, not guarantees; your target changes with your retirement age and lifestyle.
Calculate Your Net Worth
Stop guessing where you stand. Enter your assets and liabilities to see your net worth, compare it to age-group benchmarks, and project how your wealth grows over time.
Frequently Asked Questions
What is the average net worth by age in the United States?
According to the Federal Reserve's 2025 Survey of Consumer Finances (SCF), released October 9, 2026, average (mean) family net worth by age of the reference person is $135,400 under 35, $681,900 for ages 35-44, $1,244,500 for ages 45-54, $1,878,000 for ages 55-64, $1,897,600 for ages 65-74, and $1,962,200 for ages 75 and older. These averages are pulled upward by a small number of very wealthy households: the average is 4 to 5 times the median in every age group, so the median is the better benchmark for a typical family.
What is a good net worth at 35?
The 2025 SCF median for families aged 35-44 is $155,600, so a net worth above that puts you ahead of half your age group. For retirement savings specifically, Fidelity suggests 1x your salary by 30 and 3x by 40, which on a $75,000 salary is $75,000 and $225,000 in retirement accounts. Note that Fidelity's guideline covers retirement accounts only, while the SCF median covers total net worth including home equity.
Why is median net worth so much lower than average net worth?
A small group of very wealthy families pulls the average up. In the 2025 SCF, the 90th percentile of net worth starts at $2,539,200, and families in the top decile have an average net worth of $8,975,200 versus $1,241,500 for all families. For ages 35-44 the average is $681,900 but the median is only $155,600, meaning half of those families have less than $155,600. Use the median when you want to know where a typical household stands.
Did net worth for young adults really fall in the latest survey?
Yes. Between the 2022 and 2025 surveys, median net worth for families under 35 fell 23 percent in inflation-adjusted terms, from $42,700 to $33,000, and the average fell 33 percent to $135,400. The Federal Reserve attributes the decline primarily to the unwinding of business equity gains recorded between 2019 and 2022. If you are under 35 and below the 2022 headline figure of $39,000 (in 2022 dollars), that figure is no longer the current benchmark.
What counts toward net worth?
Net worth equals total assets minus total liabilities. Assets include the full market value of your home, retirement accounts (401(k), IRA, pension), taxable investments, cash and savings, and vehicle value. Liabilities include mortgages, student loans, auto loans, credit card debt, and personal loans. Counting only home equity means you have already subtracted the mortgage, so do not subtract it a second time. Annual income is not part of net worth.
How can I increase my net worth quickly?
The fastest levers are eliminating high-interest debt (credit cards at roughly 20%+ APR), contributing at least enough to earn your full employer 401(k) match, and avoiding lifestyle inflation as income rises. For 2026 the IRS limits are $24,500 for a 401(k), $7,500 for an IRA, and $4,400 (self-only) or $8,750 (family) for an HSA. Use our Net Worth Calculator to track progress and our Compound Interest Calculator to project growth.
Related Guides
How to Start Investing with $1,000: A Beginner's Step-by-Step Guide
Start investing with just $1,000. Learn which account to open, what to buy (VTI, VOO, VTSAX), and how $100/month grows to six figures over time.
How to Save $50,000 in 3 Years: A Realistic Plan
A step-by-step plan to save $50,000 in 3 years on an average salary. Includes monthly targets, budget breakdowns, a real case study, and strategies that actually work.